Master end-to-end data modeling, DAX measures, and interactive reporting for retail analytics.
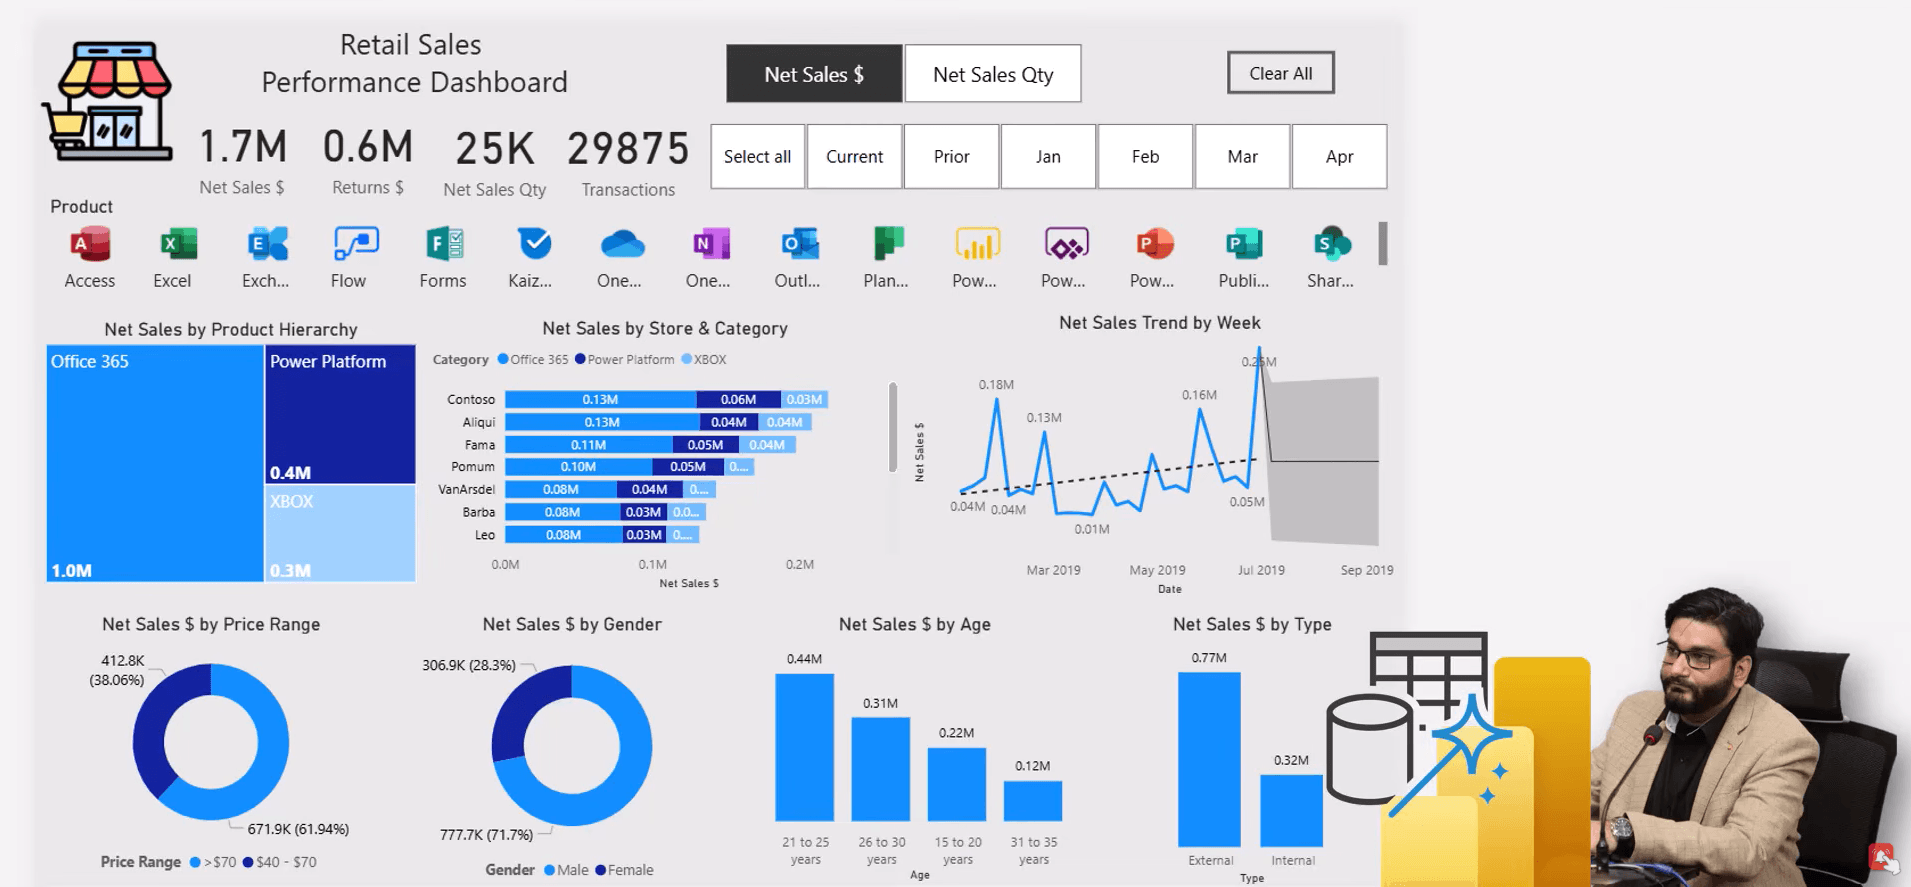
This course provides a comprehensive guide to building a retail sales performance dashboard using Microsoft Power BI. It covers the entire workflow from importing raw Excel data and performing ETL processes in Power Query to establishing a robust star schema data model. Participants will learn to create explicit DAX measures for key performance indicators, implement field parameters for dynamic reporting, and design an interactive user interface with slicers, bookmarks, and custom visualizations. The course emphasizes best practices for filter flow, context management, and professional dashboard layout to effectively communicate retail metrics.
Topics Covered:

Data, BI & AI Transformation Leader & Consultant | Founder & CEO - Excel Basement | MVP & MCT
Data, BI & AI Transformation Leader & Consultant | Founder & CEO - Excel Basement | 2X Microsoft MVP (Excel) | 9X MCT (2016-2025) | PowerBI, Excel, Fabric, Python, SQL
